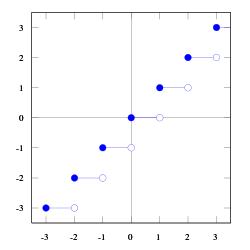
Պատկեր:Floor function.svg
Jump to navigation
Jump to search

Size of this PNG preview of this SVG file: 600 × 600 պիքսել. Այլ թույլտվությաններ: 240 × 240 պիքսել | 480 × 480 պիքսել | 768 × 768 պիքսել | 1024 × 1024 պիքսել | 2048 × 2048 պիքսել | 1000 × 1000 պիքսել.
Սկզբնական նիշք (SVG-նիշք, անվանապես 1000 × 1000 փիքսել, նիշքի չափը՝ 16 ԿԲ)
Ամփոփում
| Նկարագրում | |
| Թվական | 30 Մարտ 2006 (original upload date) |
| Աղբյուր | Բեռնողի սեփական աշխատանք |
| Հեղինակ | No machine-readable author provided. Omegatron (քննարկում · ներդրում) assumed (based on copyright claims). |
| Այլ մեկնակերպներ |
|
| SVG genesis |


Արտոնագրում
Created by User:Omegatron using gnuplot, possibly with post-processing in the GIMP (PNG) or Inkscape (SVG)
Ես, այս աշխատանքի հեղինակային իրավունքների տերը, ներկա հրատարակում եմ սրա հետևյալ լիցենզիաների պայմաններով
This file is licensed under the Creative Commons Attribution-Share Alike 3.0 Unported, 2.5 Generic, 2.0 Generic and 1.0 Generic license.
- Դուք ազատ եք՝
- կիսվել ստեղծագործությամբ – պատճենել, տարածել և փոխանցել այս աշխատանքը։
- վերափոխել – ադապտացնել աշխատանքը
- Պահպանելով հետևյալ պայմանները'
- հղում – Դուք պետք է նշեք հեղինակի (իրավատիրոջ) հղումը:
- համանման տարածում – Եթե դուք ձևափոխում եք, փոխակերպում, կամ այս աշխատանքի հիման վրա ստեղծում եք նոր աշխատանք, ապա ձեր ստեղծածը կարող է տարածվել միայն նույն կամ համարժեք թույլատրագրով։

|
Այս վավերագրման պատճենահանման, տարածման և/կամ ձևափոխման թույլտվություն կամ լիցենզիայի GNU FDL պայմաններով 1.2 մեկնակերպի կամ ավելի ուշ, հրատարակված Ազատ ծրագրային ապահովության հիմնադրամում, առանց անփոփոխելի հատվածների, առանց բնագիրների, որոնք տեղադրված են առաջին և վերջին շապիկներում: Լիցենզիայի պատճենը գտնվում է GNU Free Documentation License հատվածում: |
Կարող եք ընտրել այս թույլատրագրերից ցանկացածը։
(In short, this means that you can copy and modify the image freely as long as you provide attribution; preferably in the form of a link back to this page.)
Instructions
See Wikipedia graph-making tips.
 # Set square 1000×1000 SVG output and filename
 # The font size (fsize) sets the size for the circles, too.
 set terminal svg enhanced size 1000 1000 fname "Times" fsize 36
 set output "floor.svg"

 # Set the text value for missing entries in the data file, so we can plot a [[w:discontinuous function|discontinuous function]]
 set datafile missing "Skip"

 # Set y axis limits so the plot doesn't go right to the edges of the graph
 set yrange [-3.5:3.5]
 # Set x axis limits so the first and last points are hidden
 set xrange [-3.5:3.5]

 # No legend needed
 set nokey

 # Add lightly-colored axis lines
 set yzeroaxis
 set xzeroaxis

 # Plot as lines and also points (circles)
 plot "floor.dat" with lines
 plot "floor.dat" with points 1 6

 # Close the file (so I don't have to close gnuplot to view it)
 set output
and data file:
floor.dat
#  X     Y1
   -3    -4
   Skip
   -3    -3
   -2    -3
   Skip
   -2    -2
   -1    -2
   Skip
   -1    -1
   0     -1
   Skip
   0     0
   1     0
   Skip
   1     1
   2     1
   Skip
   2     2
   3     2
   Skip
   3     3
   4     3
Then I opened the resulting SVG file in Inkscape, changed the fill style for the circles (either blue or white fill), brought the plot lines to the top, and then brought the circles to the top (over the lines).
External links
Նիշքի պատմություն
Մատնահարեք օրվան/ժամին՝ նիշքի այդ պահին տեսքը դիտելու համար։
| Օր/Ժամ | Մանրապատկեր | Օբյեկտի չափը | Մասնակից | Մեկնաբանություն | |
|---|---|---|---|---|---|
| ընթացիկ | 01:05, 22 մայիսի 2006 | | 1000 × 1000 (16 ԿԲ) | wikimediacommons>Omegatron | i like blue better |
Նիշքի օգտագործում
Հետևյալ էջը հղվում է այս նիշքին՝